Independent Drone Aerotriangulation and LiDAR Colourisation from a Raw UAV Delivery
A public UAV benchmark block — 962 images and a LiDAR point cloud acquired on one flight over a university campus — was processed by AG2I from the raw delivery alone: the images, the RTK position and gimbal angles recorded with each exposure, and the camera's nominal focal length. The orientations, tie points and calibration published with the dataset were never opened, and no ground control was used. The camera model was solved inside the adjustment; the result was verified against the LiDAR flown on the same aircraft and against two national height benchmarks inside the block; the final orientation was then used to colour the LiDAR from the raw imagery. This study reports the sensor configuration, the adjustment, the verification, and the colourisation result.
1. Sensors and frame geometry
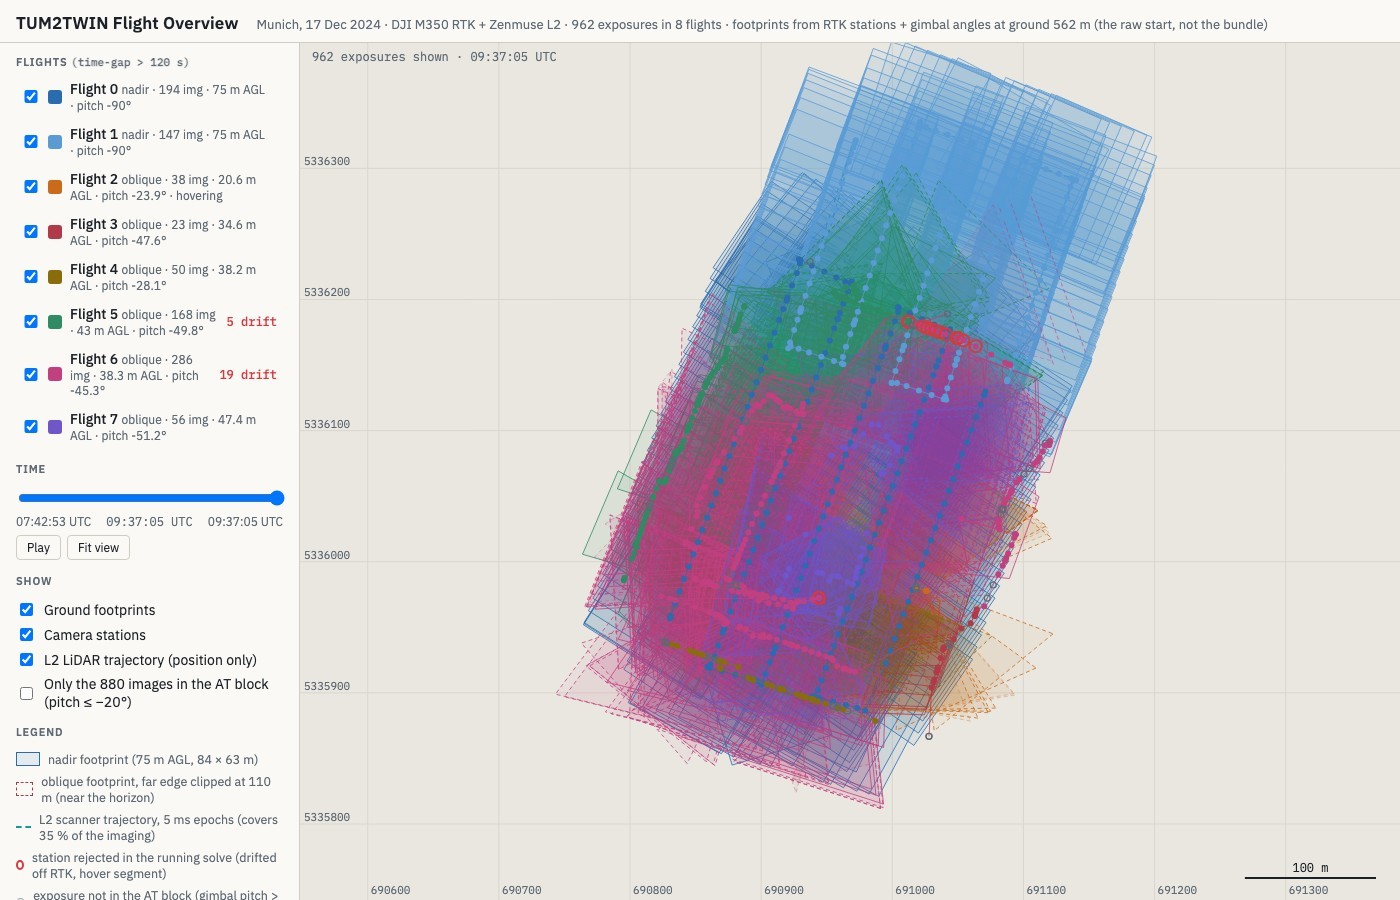
The payload was a single gimbal-mounted 20-megapixel mapping camera flown together with a LiDAR scanner. The aircraft flew level throughout and the gimbal pointed the camera, so one lens produced two imaging geometries: vertical frames from two mapping flights at 75 m above ground, and tilted frames from six low facade flights between 20 m and 47 m, at 24° to 51° off vertical. Frames were selected for the adjustment on gimbal pitch, 880 of the 962 exposures qualifying. Three data streams therefore entered production — nadir imagery, oblique imagery, and the LiDAR cloud. A payload carrying physically separate nadir and oblique heads enters the same processing chain; each geometry is one further set of frames with its own mount convention.
| Stream | As delivered | Role in production |
|---|---|---|
| Nadir imagery | Two flights at 75 m above ground; 369 frames submitted, 368 kept | Block geometry and vertical scale |
| Oblique imagery | Six flights at 20–47 m, 24–51° off vertical; 511 frames submitted, 478 kept | Focal-length observability; facade colour |
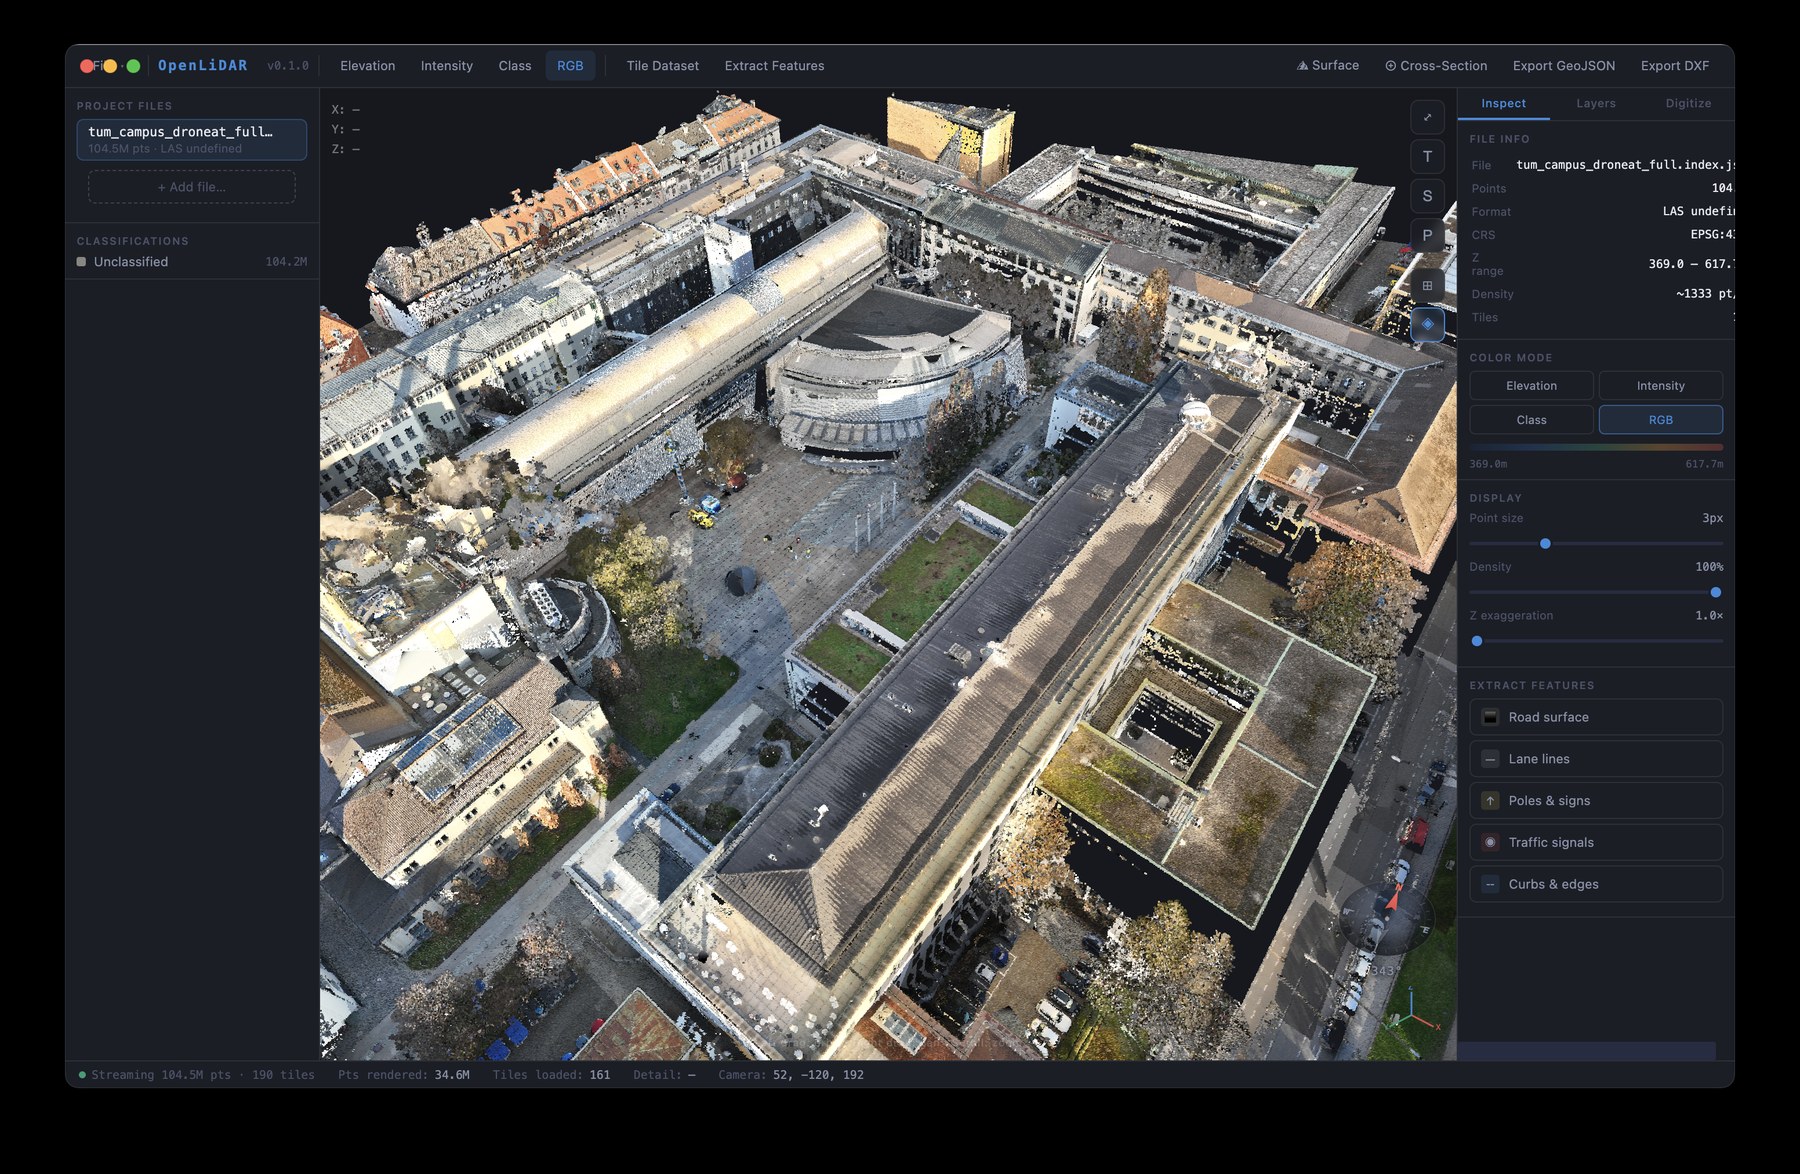
| LiDAR | 104.5 M points over the block core, 953 pts/m² | Independent check, then the geometry that is coloured |
LiDAR density is quoted as the median over occupied one-metre cells across the whole delivered cloud. The mean over the same cells is 1,339 pts/m²; on airborne LiDAR a mean is inflated by facades, where a wall projects its full height into a single ground cell.
2. Aerotriangulation and camera self-calibration
Exposure positions were taken from the per-image RTK record. Two conventions were measured rather than assumed: the exposure clock of every input was verified before use, and the camera mount was determined from the imagery itself — the scanner's mapping camera records a 180° gimbal roll on nadir frames and none on oblique frames, and a single mount model applied to both leaves every oblique frame inverted with respect to the block. Features were matched across all candidate pairs and chained into multi-ray tie points; orientations, tie points and the full frame-camera model — focal length, principal point, three radial and two tangential distortion terms — were then adjusted together, orientations before lens, weighted by each input's own reported precision.
| Adjustment | Nadir block | Full block (nadir + oblique) |
|---|---|---|
| Images in the adjustment | 345 | 880 submitted (369 nadir + 511 oblique), 846 kept |
| Image observations / tie points | 1,221,781 / 317,604 | 2,284,206 / 658,509 |
| Median image residual | 0.232 px | 0.225px |
| σ₀ of unit weight | 0.298 | 0.308 |
| Camera stations vs fixed RTK (rms) | 0.036 m | 0.026–0.040m |
| Implied camera-to-antenna offset | 0.01–0.02 m | under 0.01 m |
Thirty-four camera stations were rejected. All lay in segments where the aircraft held position while the gimbal swept: consecutive frames sharing no baseline, which drifted 0.8 m to 7.7 m away from a fixed RTK record while still fitting their own images to 0.2 px. Image-level blunder rejection cannot detect this condition, because the residuals are small once the cameras have followed their own points; the stations are identified against the recorded RTK positions and removed.
3. Focal length and flying height
A block flown at a single height over level ground cannot separate focal length from flying height: a shorter focal length lifts every measured point equally, and no image residual objects. The oblique flights were included to break that ambiguity. They make the focal length estimable — 3707.98 ± 0.09 px — but not yet accurate. Measured against the LiDAR, the surface seen by the nadir imagery moved from −0.127 m with the focal length held at its nominal value to +0.181 m with it free, the direction and magnitude a 17 px shorter focal length predicts at 75 m; interpolating the two runs gives an unbiased focal length near 3718 px. Varied viewing geometry improves observability, and independent vertical control is what makes the camera metric.
4. Verification
Tie points were compared with the LiDAR surface point-to-plane. The same comparison was run LiDAR-against-itself at the same locations to establish the noise floor against which the photogrammetric result must be read.
| Comparison | Vertical median (m) | MAD (m) | LiDAR noise floor |
|---|---|---|---|
| Nadir block, focal at nominal | −0.127 | 0.077 | 0.022m |
| Full block, points seen by ≥ 1 nadir frame | +0.181 | 0.155 | 0.020m |
| Full block, oblique-only points | −0.028 | 0.096 | 0.020m |
Two national height benchmarks (order-2 levelling points, σ ≤ 2 mm) lie inside the block. Their published heights, reduced to pavement level, were compared with the LiDAR cloud after converting its ellipsoidal heights with the national quasi-geoid model.
| Benchmark | Published pavement height | LiDAR, converted | Difference |
|---|---|---|---|
| Benchmark 1 | 514.786 m | 514.761 m | −0.025m |
| Benchmark 2 | 514.395 m | 514.417 m | +0.022m |
The LiDAR against which the photogrammetry is measured therefore sits on the national height datum to within 0.025 m. The verification chain is tied to state survey control, using open data only.
5. LiDAR colourisation
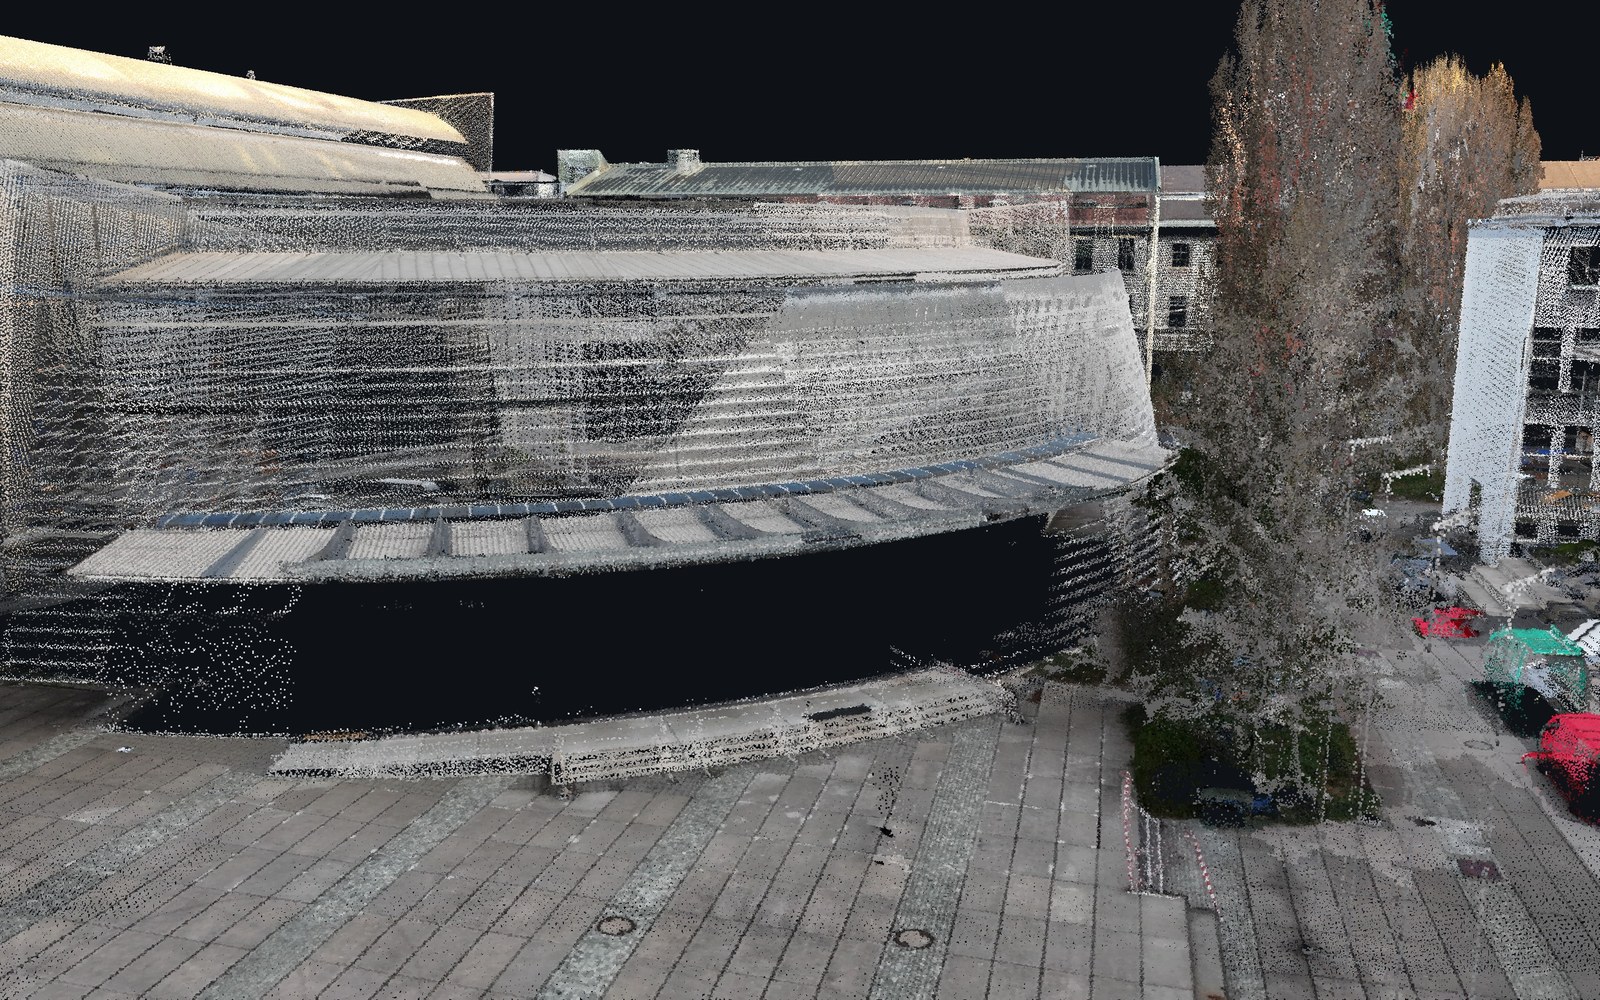
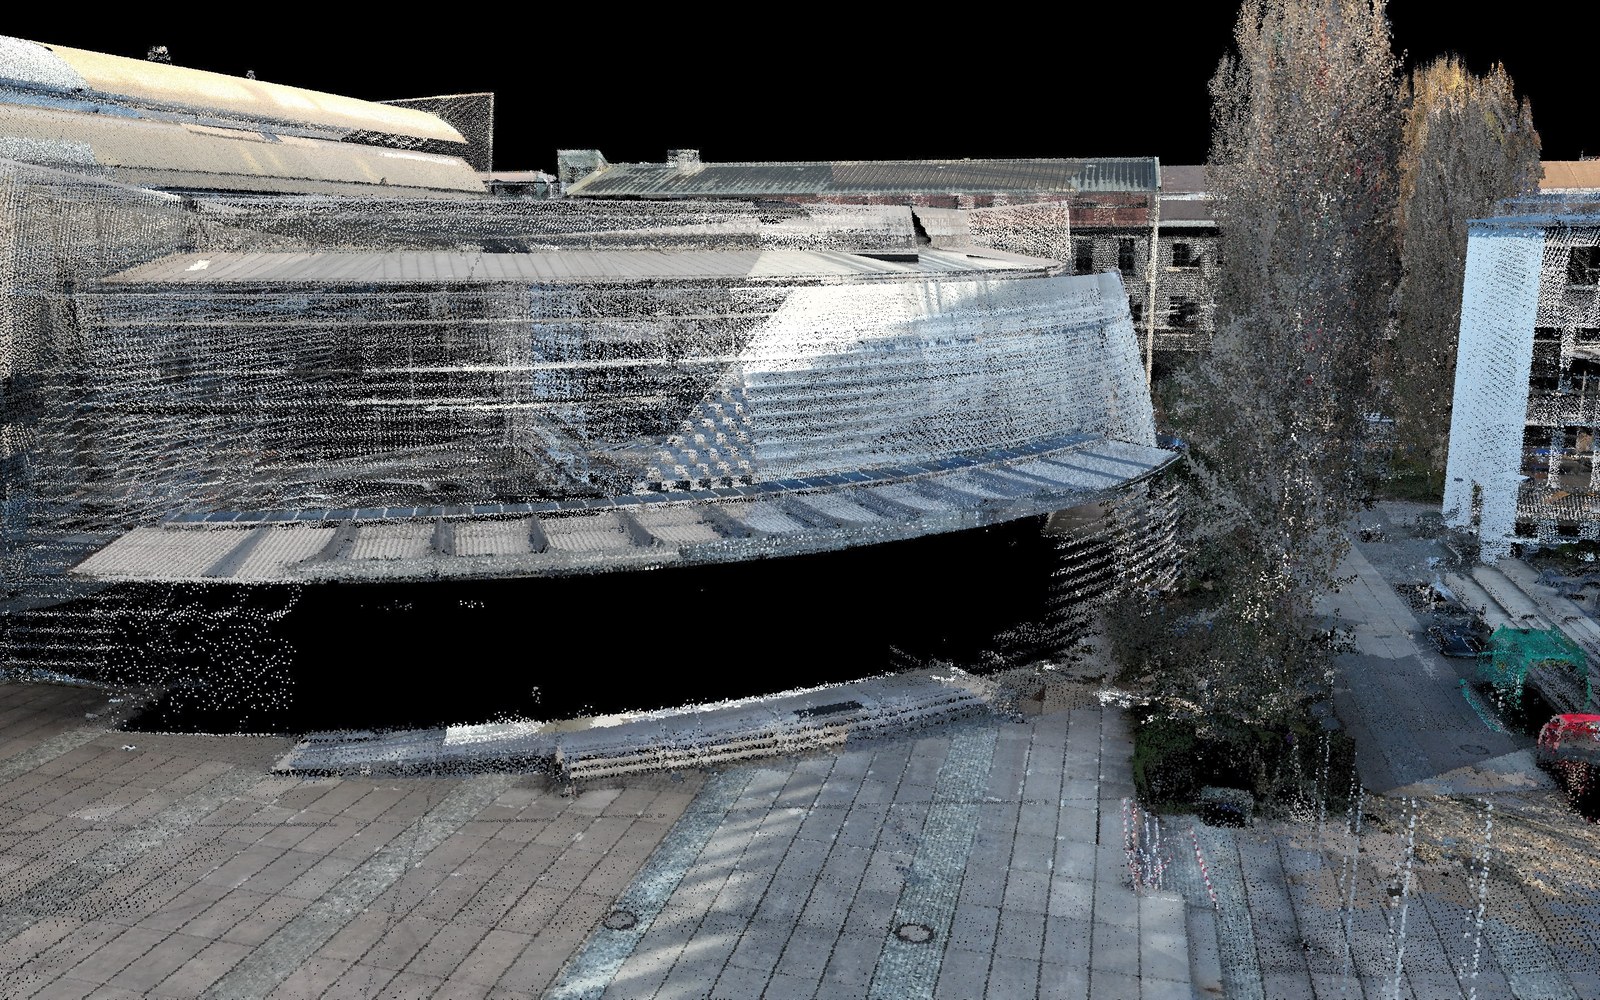
The final orientation was used to colour the LiDAR from the raw imagery. Each point takes the colour of the best-placed camera that can actually see it: occlusion-tested against per-image depth buffers, with roofs and ground preferring steep views and walls the nearest camera facing them. Camera stations rejected by the adjustment contribute no colour. Colour that sits exactly on geometry is itself a check on the orientation — a wrong solution slides colour off the buildings.
| Colourisation | Nadir imagery only | Nadir + oblique |
|---|---|---|
| Images used | 345 | 846 |
| LiDAR points carrying image colour | 96.9 % | 98.5 – 99.6% |
6. Report
The full technical report is available on request: contact AG2I.
Study data: a public UAV benchmark block — 962 images and an on-board LiDAR cloud from a single flight — processed from the raw delivery. All survey results in metres; camera focal length in pixels, a hardware quantity. Data: TUM2TWIN, CC-BY-4.0, TU Munich (Wysocki, Schwab, Biswanath et al., 2025, ISPRS Journal of Photogrammetry and Remote Sensing). Height benchmarks and quasi-geoid: Bayerische Vermessungsverwaltung and Bundesamt für Kartographie und Geodäsie, CC-BY-4.0. Contact: info@ag2i.ai.