Drone LiDAR as Geodetic Control for Legacy Mobile and Airborne Surveys
Three earlier laser surveys of the TUM city campus in Munich — a 2016 mobile survey from a van carrying two Velodyne HDL-64E scanners on an Applanix POS LV, a 2018 repeat of the same drive with the same system, and a 2009 airborne survey from a RIEGL scanner with Applanix navigation on a Bell UH-1D helicopter — were locked to a December 2024 drone LiDAR survey flown with a DJI Zenmuse L2 on a Matrice 350 RTK, used as the sole control. No ground control points were used, and the drone and the earlier surveys share no sensor, trajectory or calibration. Every result below is measured on control surfaces withheld from every fit. This study reports the data, the method, the accuracy of each survey before and after the lock, and an independent check of the control itself against state height data.
1. Data
The control is the TUM2TWIN drone survey: one nadir and one oblique flight with an RTK-positioned DJI Zenmuse L2, 393.6 million points. The legacy surveys are TUM-MLS-2016 and TUM-MLS-2018 — a van carrying two Velodyne HDL-64E scanners on an Applanix POS LV trajectory, with a stated accuracy of 0.5 m absolute — and five airborne strips from 2009. The three legacy surveys are delivered in one shared local frame. Scanner 1 of each mobile drive was used in full.
| Survey | Acquired | Points used | Role |
|---|---|---|---|
| Drone LiDAR, nadir + oblique | December 2024 | 393.6 M | Control |
| Mobile LiDAR, scanner 1 | 2016 | 314.7 M | Locked to the control |
| Mobile LiDAR, scanner 1 | 2018 | 369.2 M | Locked to the control |
| Airborne LiDAR, 5 strips | 2009 | 8.0 M | Locked to the control |
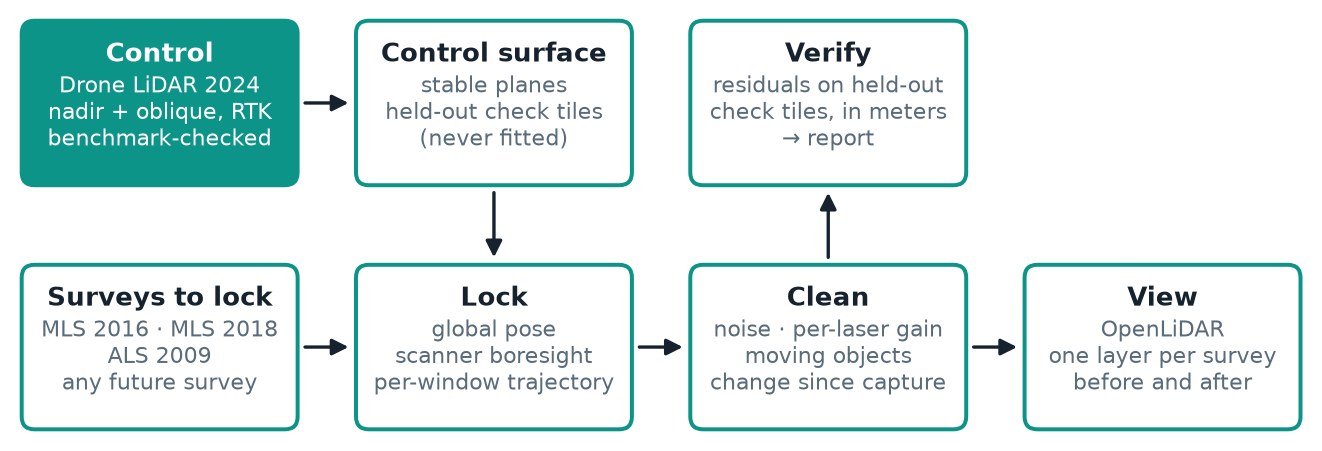
2. Method
The drone survey was reduced to its stable surfaces — road, pavement, façades and roofs — and part of it was withheld from every fit and used only for verification. Each legacy survey was then fitted to that control along its trajectory.
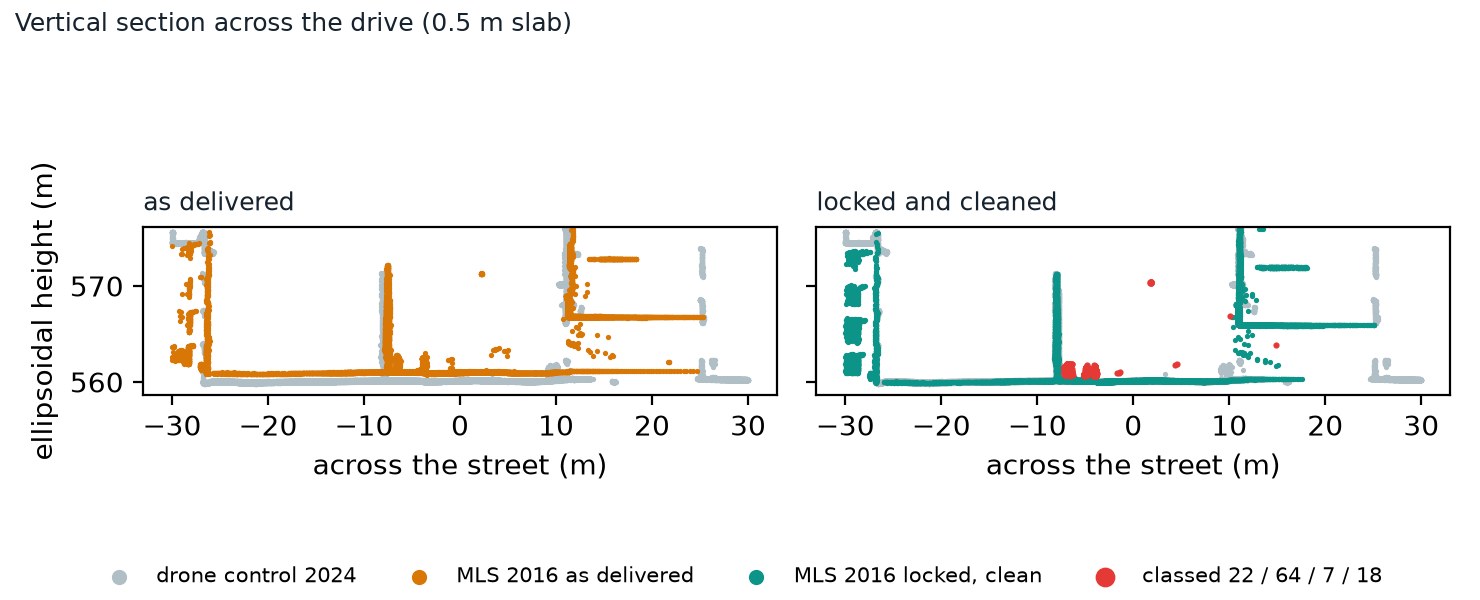
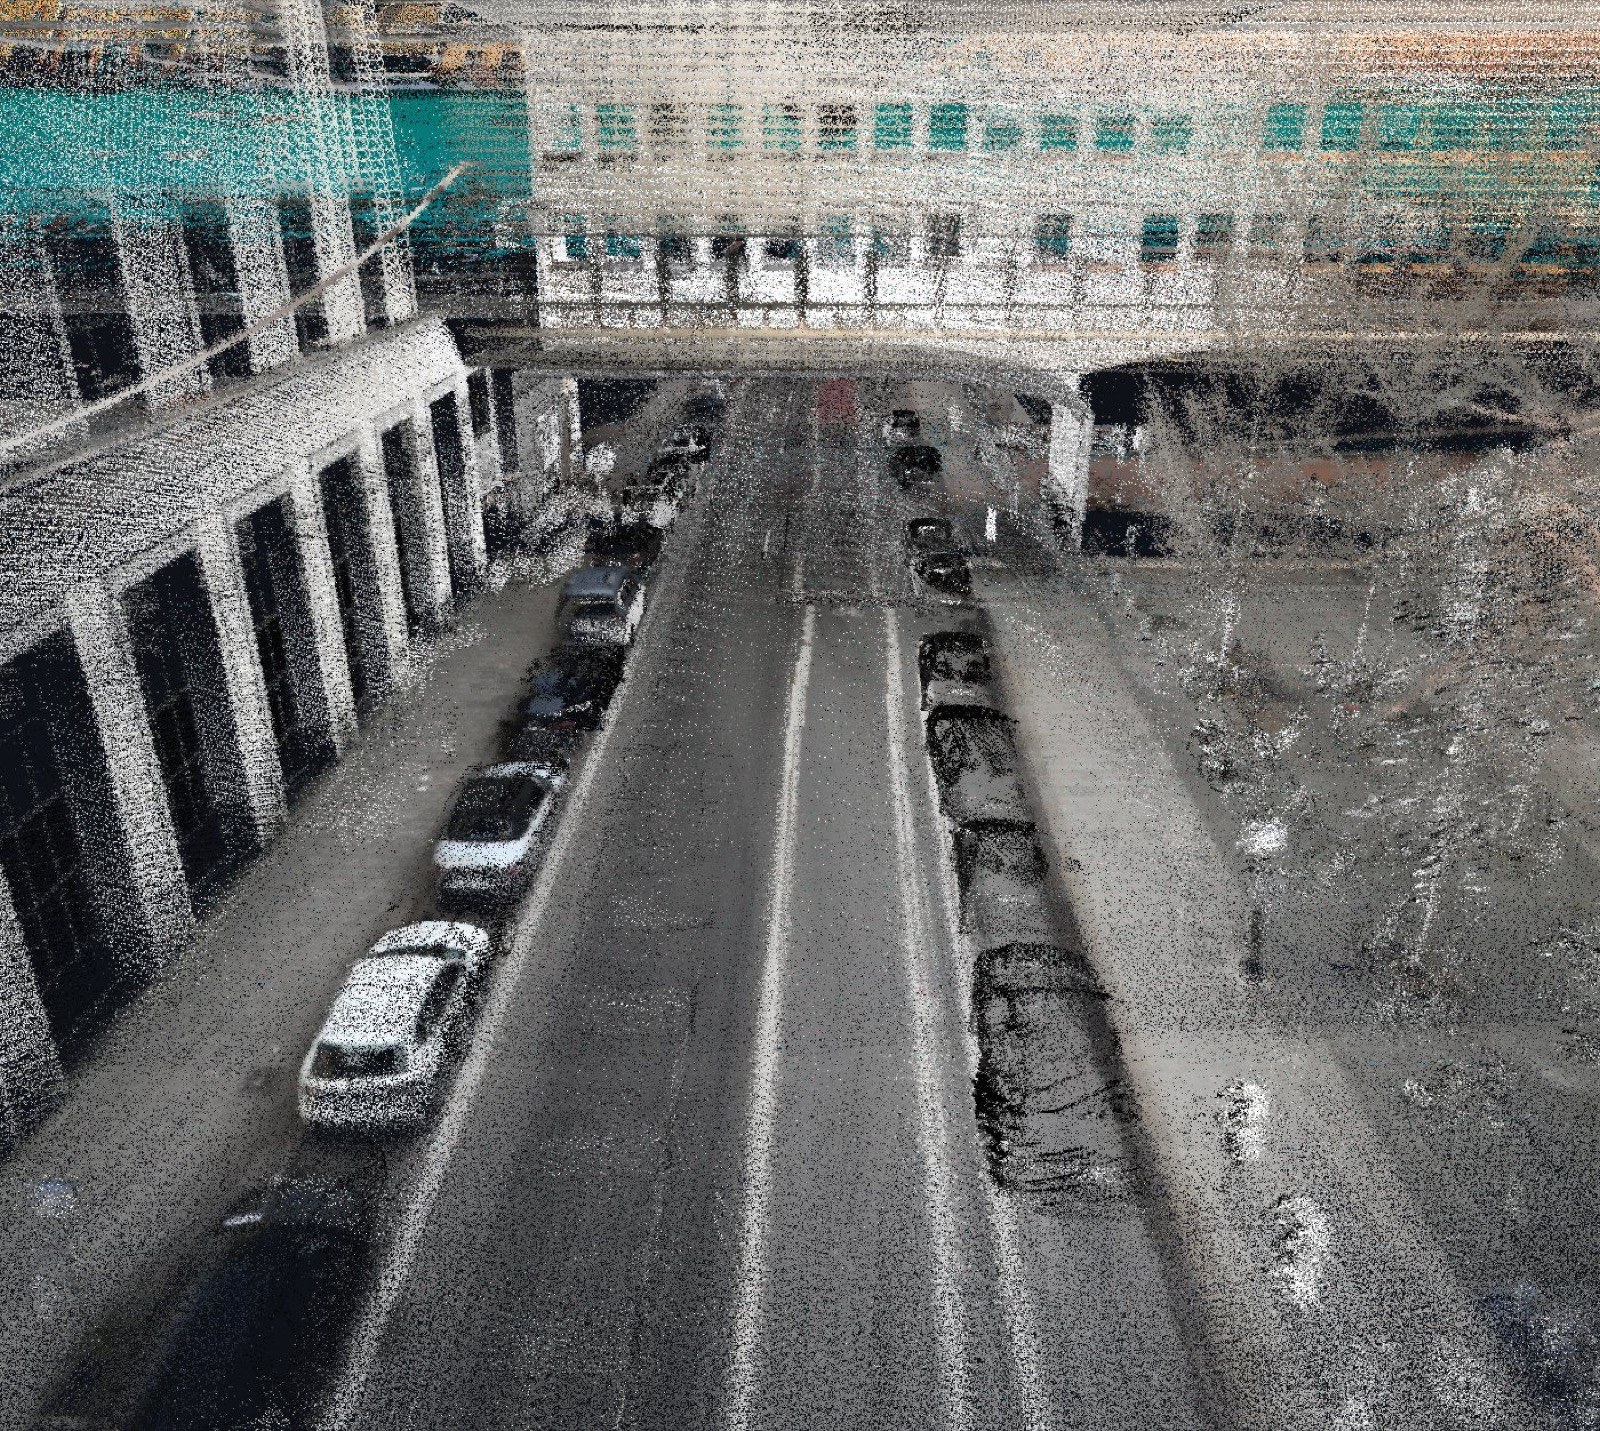
The surveys were then cleaned against the control without deleting any point: noise, moving objects, and objects no longer present in 2024 are each assigned their own class. Scanner reflectance was normalised.
3. Mobile survey, 2016
| Stage | All surfaces (RMS) | Ground | Façades | Within 0.05 m |
|---|---|---|---|---|
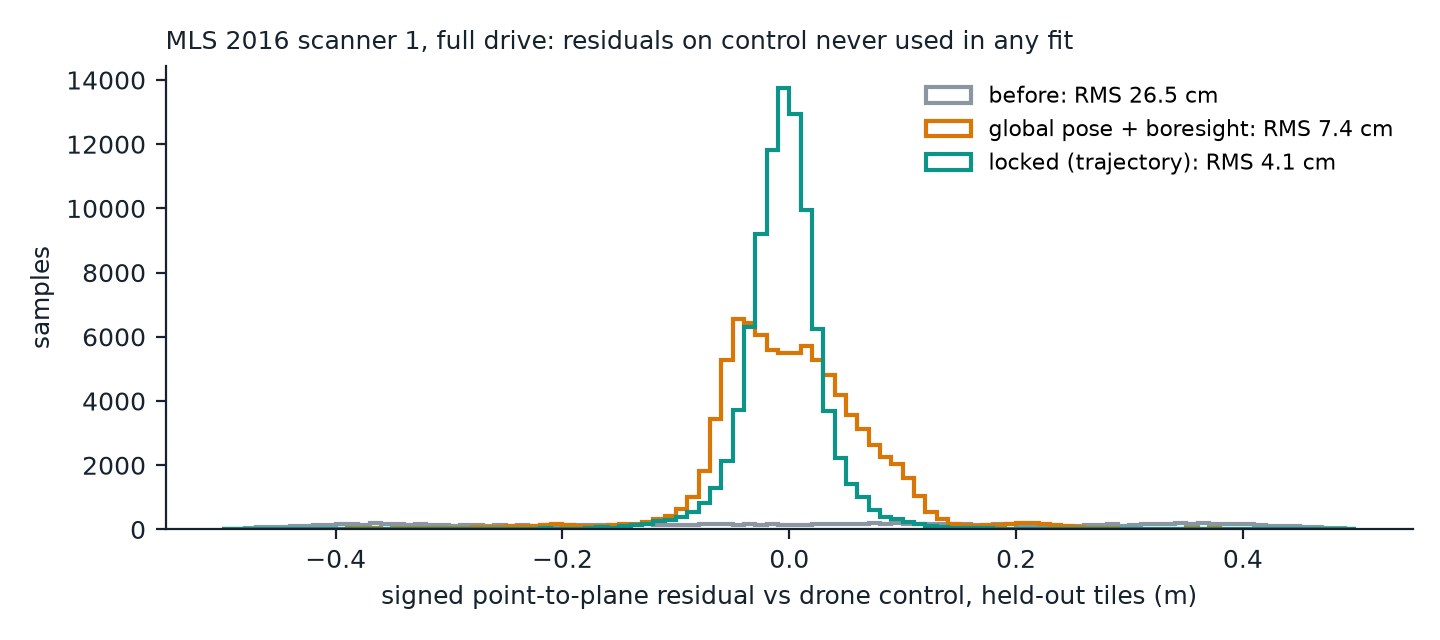
| As delivered | 0.265 m | 0.261 m | 0.266 m | 11% |
| Single transform | 0.074 m | 0.056 m | 0.116 m | 62% |
| Locked along the trajectory | 0.041 m | 0.036 m | 0.053 m | 88% |
As delivered, the survey sits 0.47 m east and 0.84 m high of the control. After a single transform, the remaining trajectory error still reaches 0.46 m east and 0.28 m north in the second half of the 14.7-minute drive; a single transform cannot represent it, which is why the lock along the trajectory halves the façade error again. The residual façade error does not grow with range. About half of it sits on a few façades consistent with construction between 2016 and 2024; the rest reflects the drone survey's own wall quality. Three to five centimetres is the floor of this pairing, set by the control rather than the lock.
4. Mobile survey, 2018
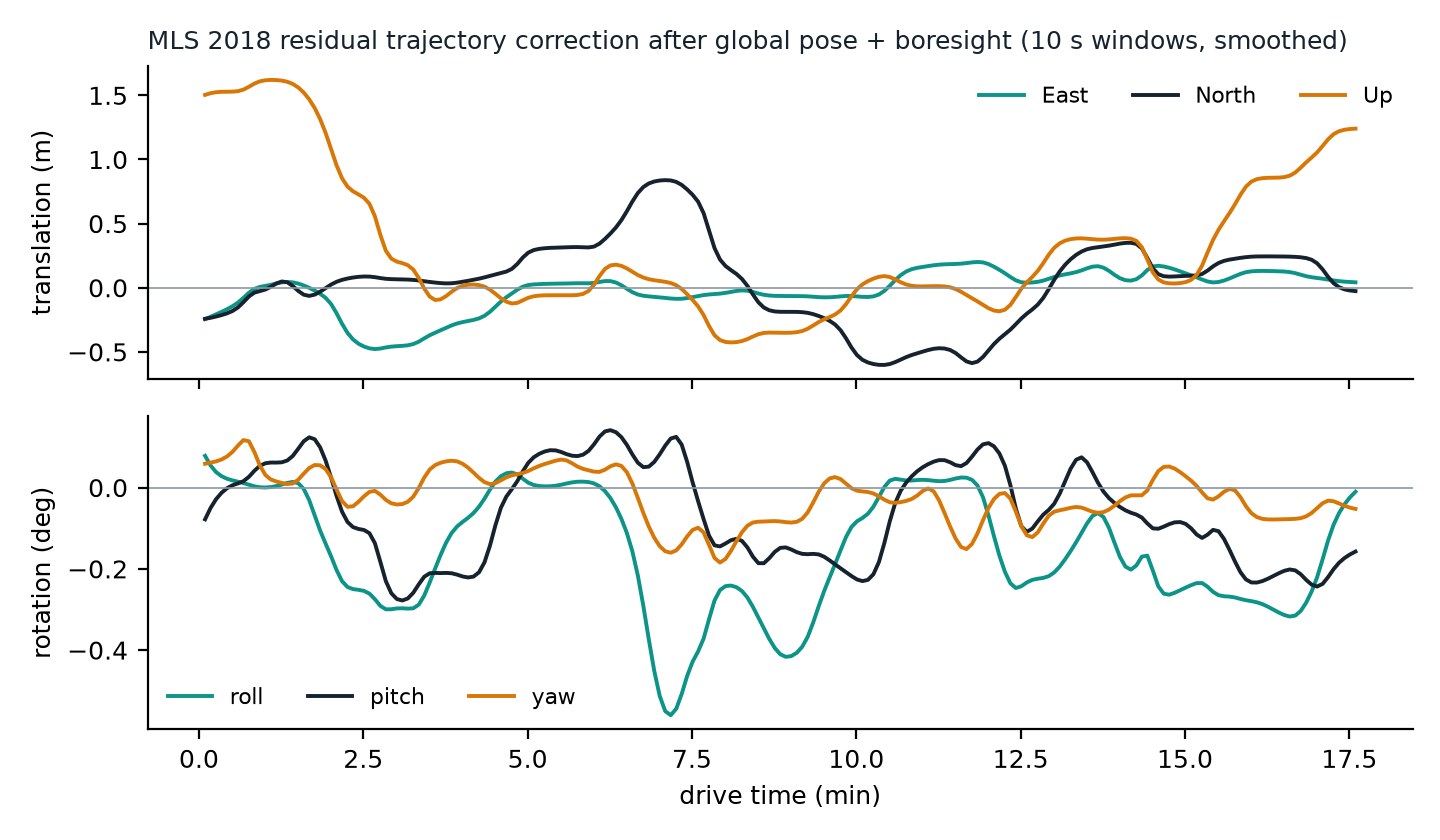
The 2018 drive repeats the 2016 route with the same vehicle, but its delivered trajectory error is much larger and uneven: 1.6 m in height at the start of the drive and 1.25 m at the end, with excursions of ±0.8 m north. A single transform barely helps (0.231 m to 0.221 m). The lock brings the survey to the level of 2016. Its scanner mounting differs from 2016, consistent with a remount.
| Stage | All surfaces (RMS) | Ground | Façades |
|---|---|---|---|
| As delivered | 0.231 m | 0.227 m | 0.243m |
| Single transform | 0.221 m | 0.221 m | 0.219m |
| Locked along the trajectory | 0.047 m | 0.041 m | 0.059m |
5. Agreement between the two mobile epochs
Each epoch was locked to the drone control independently; neither saw the other. Their disagreement therefore measures the repeatability of the procedure. On 25,498 stable one-metre ground cells common to both epochs, the 2018 minus 2016 height difference has a median of +0.005 m, a MAD of 0.030 m and an RMS of 0.039 m — two surveys with different delivered errors (0.27 m and up to 1.6 m) and different scanner mountings, brought to the same reference and agreeing with each other at the level to which each agrees with that reference.
6. Airborne survey, 2009
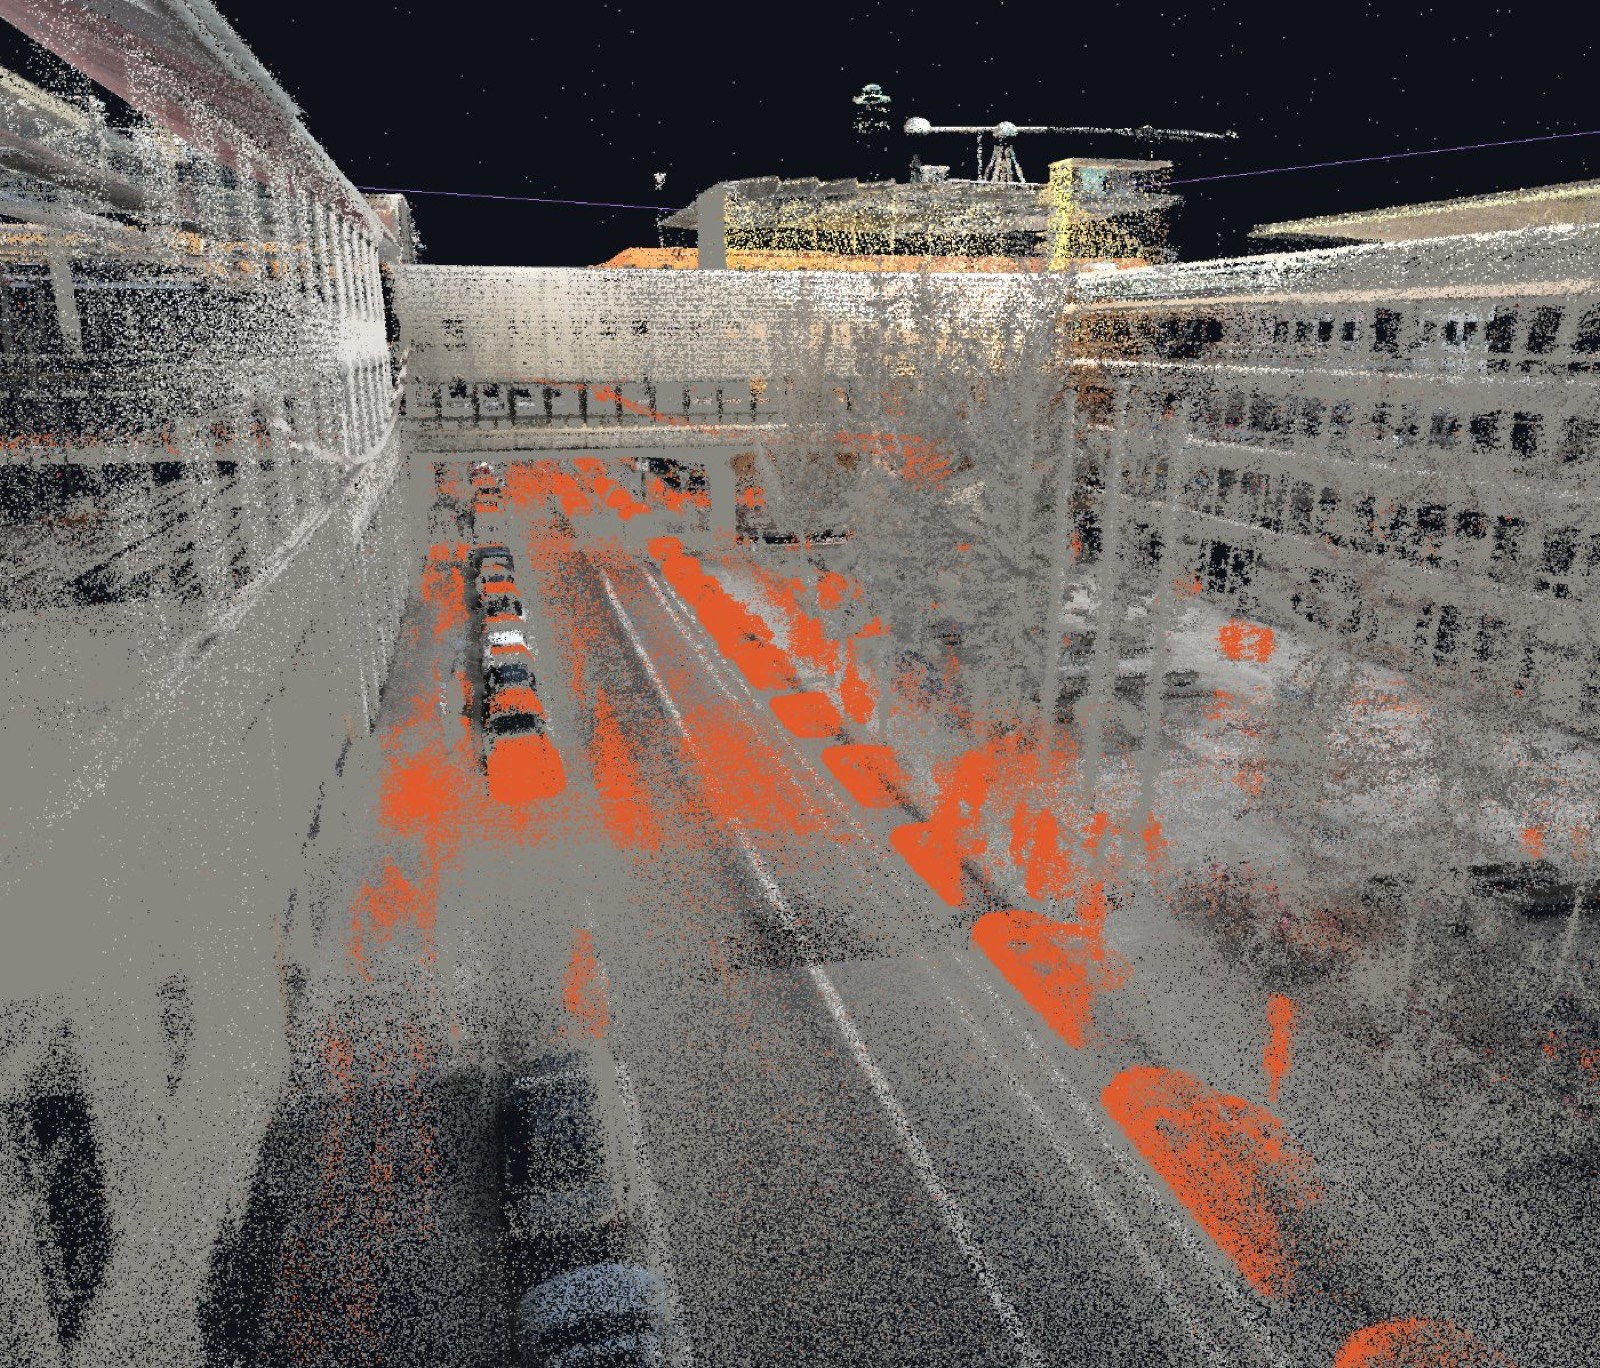
The five airborne strips sit 0.70 m high of the control (median over 32,230 flat one-metre cells, MAD 0.070 m). A single transform per strip takes their ground RMS from 0.33–0.38 m to 0.043–0.088 m, the remainder dominated by the survey's 0.7 m point spacing and fifteen years of surface change. The 2009 airborne survey and the raw 2016 mobile survey carry nearly the same offset — about 0.45 m east and 0.7–0.8 m high — although they share no sensor and no trajectory. The offset is therefore a property of the shared local frame in which the legacy surveys were delivered, relative to the drone's RTK realisation; each survey adds its own error on top, and the lock removes both together.
7. Verification of the control
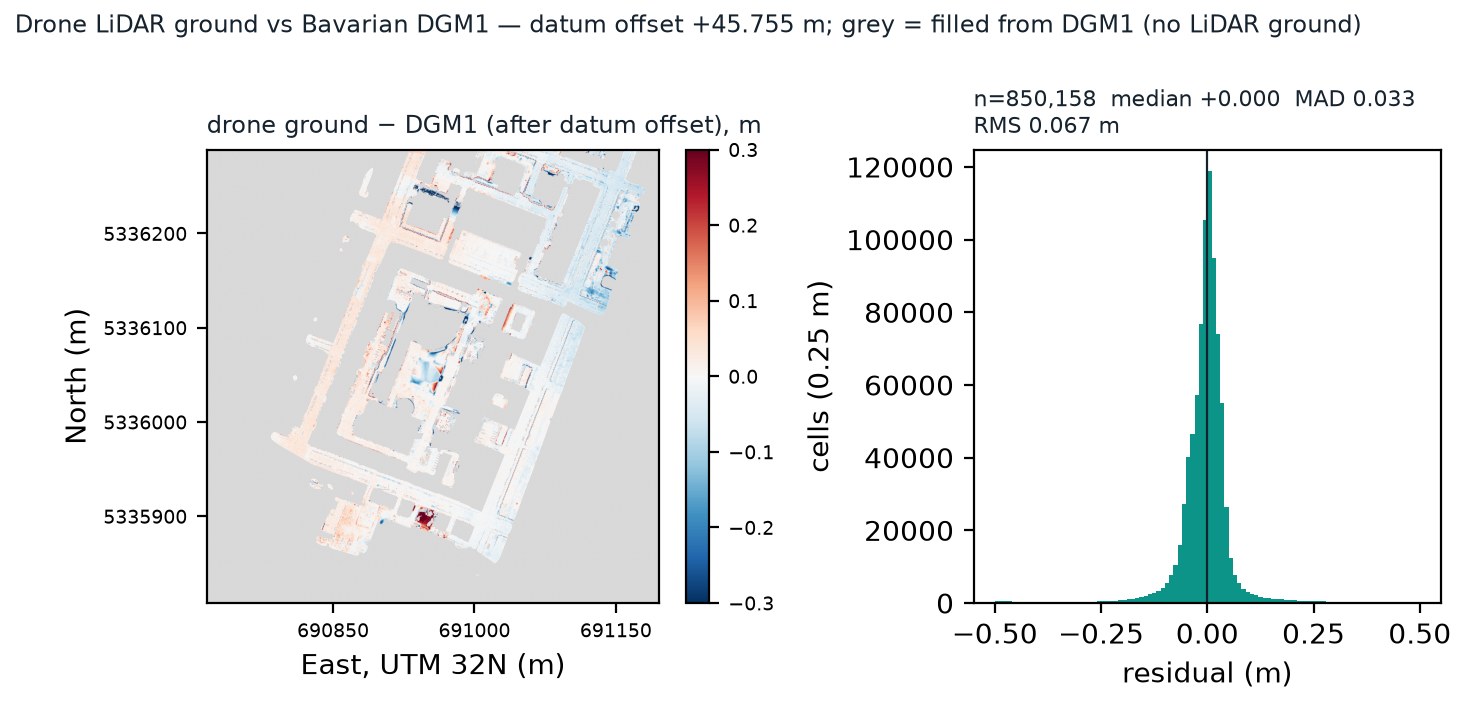
The control is itself checked against independent state data. Two national height benchmarks inside the block agree with the drone LiDAR to −0.025 m and +0.022 m. Over 850,158 ground cells of 0.25 m, the drone ground agrees with the Bavarian 1 m digital terrain model (DGM1), after the ellipsoid-to-national-datum offset of +45.755 m, to a median of 0.000 m and a MAD of 0.033 m (RMS 0.067 m).
8. Orthophoto on the verified ground
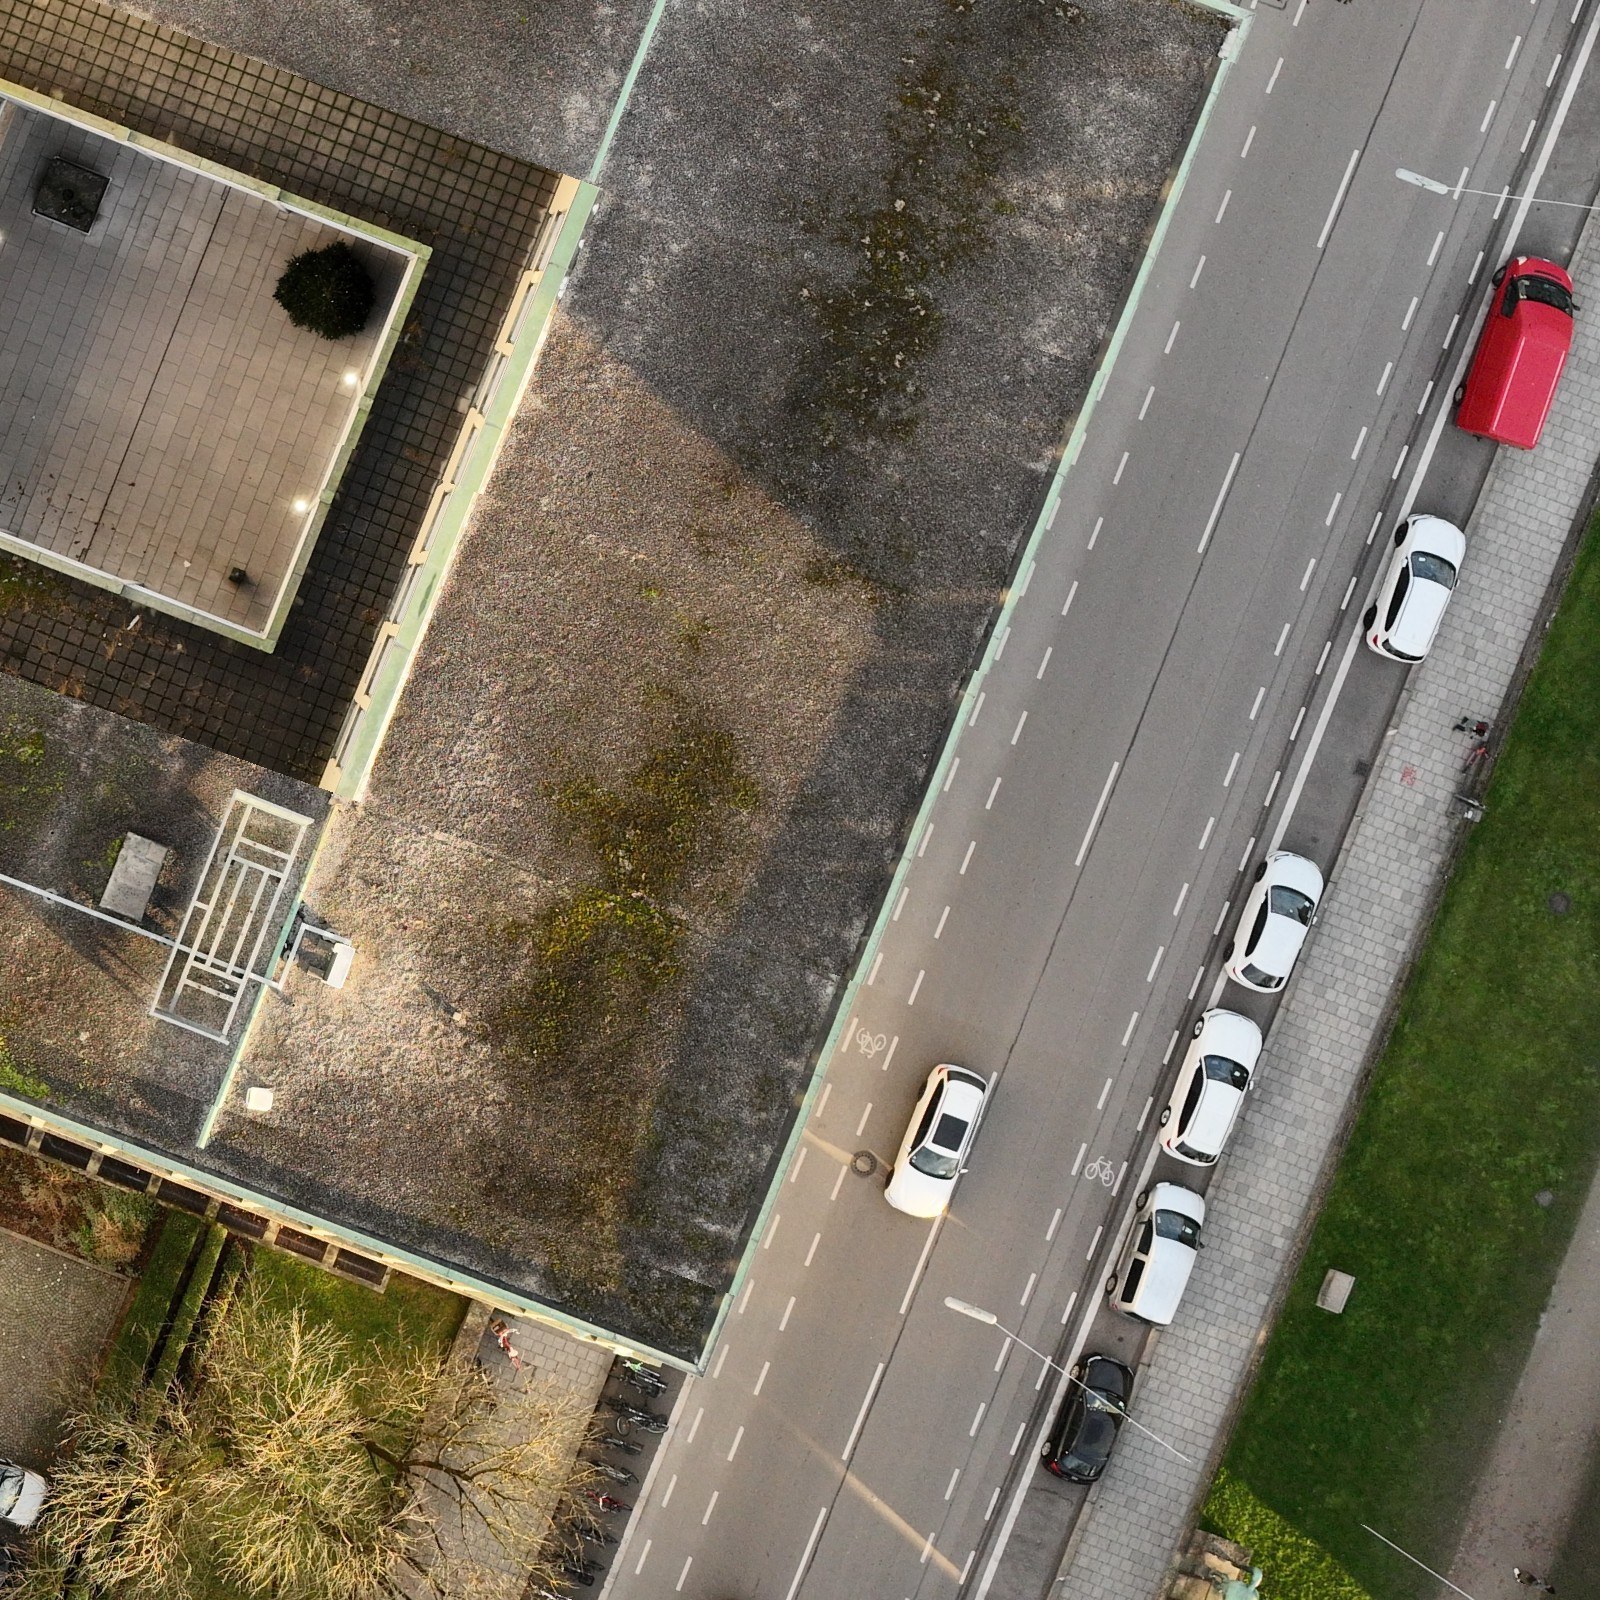
The 345 nadir drone frames were orthorectified at 0.03 m pixel size onto the classified ground surface, with each output pixel taken from exactly one photograph. Against the dataset publisher's independent orthophoto, on 13 patches of verified ground, the median shift is −0.003 m east and +0.003 m north, with a MAD of 0.036 m and 0.043 m. The 0.03 m figure is the pixel size; the registration accuracy is the 0.036–0.043 m MAD.
9. Report
The full technical report is available on request: contact AG2I.
Acknowledgement
Special thanks to Dr. Marcus Hebel of Fraunhofer IOSB for access to the TUM-MLS-2016 and TUM-MLS-2018 datasets and for permission to publish these results.
All survey results in metres, measured on control withheld from every fit. Data: TUM2TWIN, TU Munich, CC-BY-4.0 (Wysocki, Schwab, Biswanath et al., 2025, ISPRS Journal of Photogrammetry and Remote Sensing). TUM-MLS-2016 and TUM-MLS-2018: Fraunhofer IOSB and TU Munich, CC-BY-NC-SA-4.0 (Gehrung, Hebel, Arens, Stilla, 2017, ISPRS Annals IV-1/W1; Zhu et al., 2020, Remote Sensing 12, 1875); TUM-ALS-2009 (Hebel, Stilla, 2012, IEEE TGRS), distributed with TUM-MLS-2016. Results derived from the TUM-MLS and TUM-ALS data are published with the permission of Fraunhofer IOSB; the data themselves are not redistributed. Height benchmarks, quasi-geoid and DGM1: Bayerische Vermessungsverwaltung and Bundesamt für Kartographie und Geodäsie, CC-BY-4.0. Contact: info@ag2i.ai.